Noise measurement, LO substitution, receiver stress testing, power measurement, CCDF and PAPR characterization, and antenna-pattern measurement play critical roles in link budget, bit-error rate, and SNR requirements.
By Bob Buston, Wireless Telecom Group
Low-Earth orbit (LEO) satellite systems are being deployed for mission-critical use cases at an accelerating rate. This brings associated critical test requirements that, if not performed accurately, could lead to degraded system performance. Using a gateway as an example, this article looks at measurements and the type of equipment required for uplink and downlink physical-layer testing.
Satellite deployments range from geostationary orbit (GEO) and medium-Earth orbit (MEO) to LEO. Deployment rates of LEO satellites keep increasing. For example, the SpaceX Starlink system currently has approximately 3,500 satellites in low Earth orbit. In December 2022, the FCC approved the deployment of 7,500 next-generation satellites. Due to the low latency of LEO systems, they are becoming the system of choice for both civil and military applications including, but not limited to, 5G and military battlefield communications. Ukrainian use of the Starlink system, although limited, is a recent example of the latter. The use of LEO systems for these types of operations leads to a requirement for high-accuracy testing to ensure reliable operation.

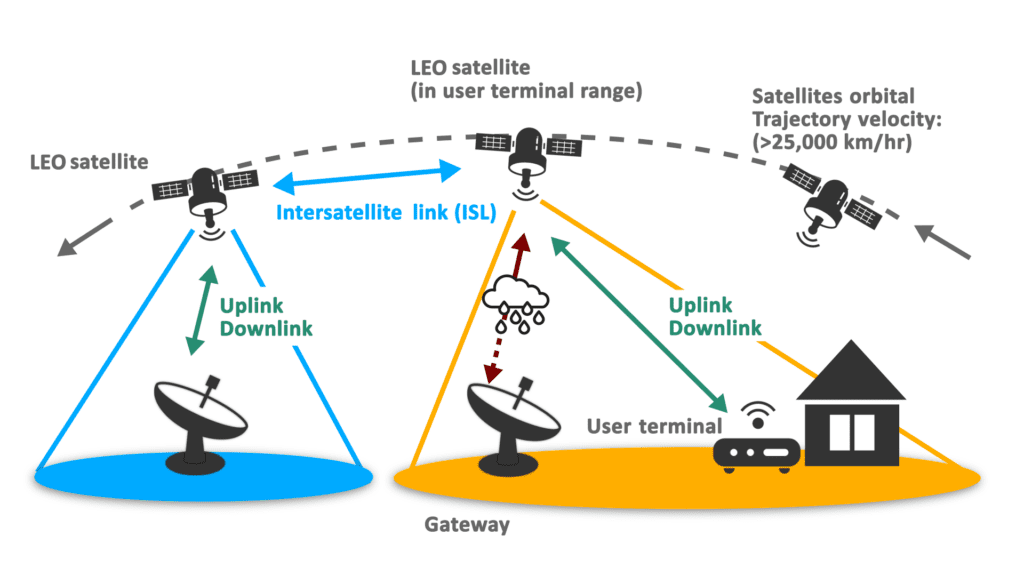
Ground stations, also referred to as gateways when connecting to the terrestrial network, are a key element of up and downlink operation, as shown in Figure 1. The various modules comprising the uplink and downlink paths require a variety of tests to ensure reliable operation. Such testing may be performed during the development and production of the modules, during integration, as part of fault-finding, and during operational monitoring. Figure 2 shows a simplified block diagram of the RF and microwave paths in a gateway and examples of where test equipment would be used to assess physical-layer performance.

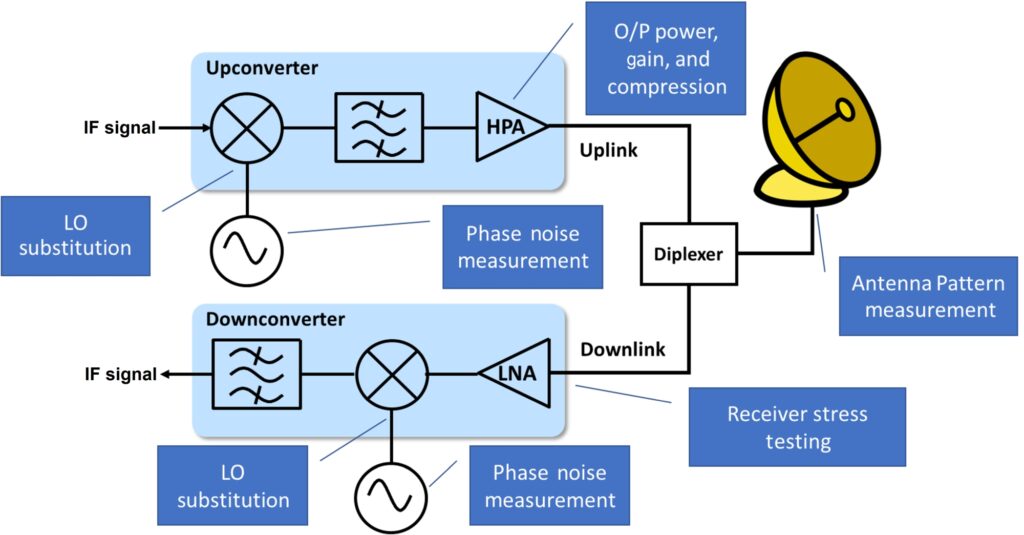
Table 1 shows additional information and the importance of performing measurements at the points shown in Figure 2.
|
||||||||||||||||||||||||||||
| Table 1. Six critical use cases to verify uplink and downlink physical layer performance. |
Next, we’ll look at these use cases in more detail.


Phase noise measurement
Many factors contribute to the performance of satellite up and downlinks and several of them, such as the signal purity of the local oscillators, impact bit errors. Excessive phase noise increases error vector magnitude (EVM) and can lead to symbol and hence bit errors because the position of the constellation points on the I-Q diagram cross over symbol decision boundaries as shown in Figure 3.
When making this measurement, ask yourself if you need to make absolute phase-noise measurements of the local oscillator (LO) to measure additive noise from amplifiers.
LO substitution
LO substitution is an important technique when testing upconverters and downconverters in communication systems. It lets you evaluate signal chains without the characteristics of the LO masking their performance. This technique also lets you determine if the LO is the source of issues when the system is not performing properly.
Receiver stress testing
Whether in a gateway or in a satellite, it is important to stress test the receiver to ensure that signals can be received and demodulated correctly under impaired conditions. To ensure performance observed in the lab is replicated after deployment, satellite communication receivers must operate in real-world RF interference conditions. These tests are performed at IF and at RF. When performed at IF, you will need:
- Signal-to-noise ratio (SNR) noise generator to set levels of either SNR or Eb/No
- Bit error rate tester (BERT). The uplink IF is looped back to the downlink IF through the SNR generator. If the testing is at RF/microwave frequencies, a test loop translator will also be needed to complete the loop back. Figure 4 shows the general test setup for the two cases.

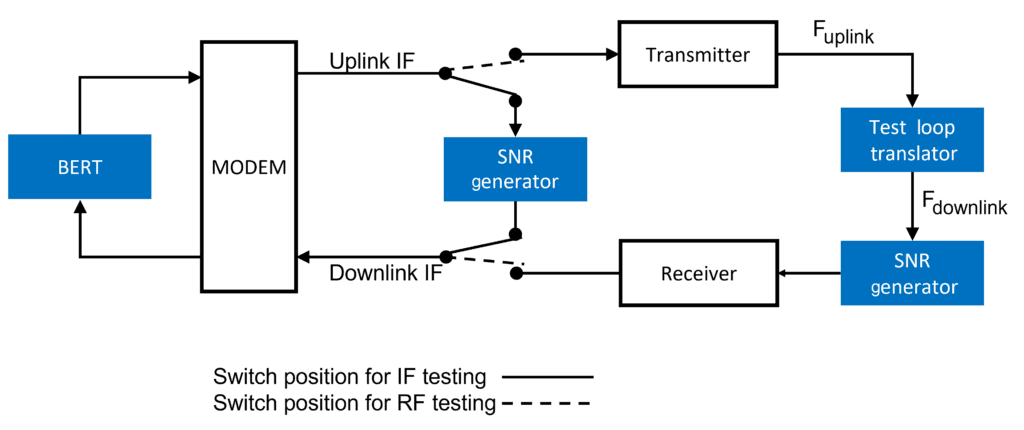
To perform the test, the SNR generator adds a precise amount of noise to produce the desired SNR level. The level of noise is increased until the desired error rate limit, as monitored by the BERT, is reached. Additionally, a signal generator may be used to inject an interfering signal.
Output power, gain, and compression testing
This brings us to one of the most fundamental RF and microwave measurements: power. Power measurement can also uncover some critical issues that could impact system performance. Figure 5 shows a setup for evaluating the performance of the uplink high-power amplifier (HPA).


In addition to the measurement of gain and return loss, power sensor P2 provides a measure of the output power level. You can also use this setup to assess the degree of signal compression being caused by the HPA.
Historically, satellite links have used low peak-to-average power ratio (PAPR) modulation formats. Newer applications, such as 5G non-terrestrial networks (NTN), however, require the use of higher-order modulation schemes and OFDM. This means that the PAPR of the signal will be higher, and it will be necessary to take care that amplifier compression does not distort the peaks leading to symbol and hence bit errors. There have been several studies of the effect of PAPR reduction on bit error rate due to signal compression. A study by Usman et al showed that reducing the PAPR from 10 dB to ~4dB would degrade the BER from ~8 x 10⁻⁴ to ~1.3 x 10⁻³ for an SNR of 10 dB at the receiver. This highlights the importance of knowing the impact of power-amplifier distortion on PAPR and of having a means to clearly observe it.
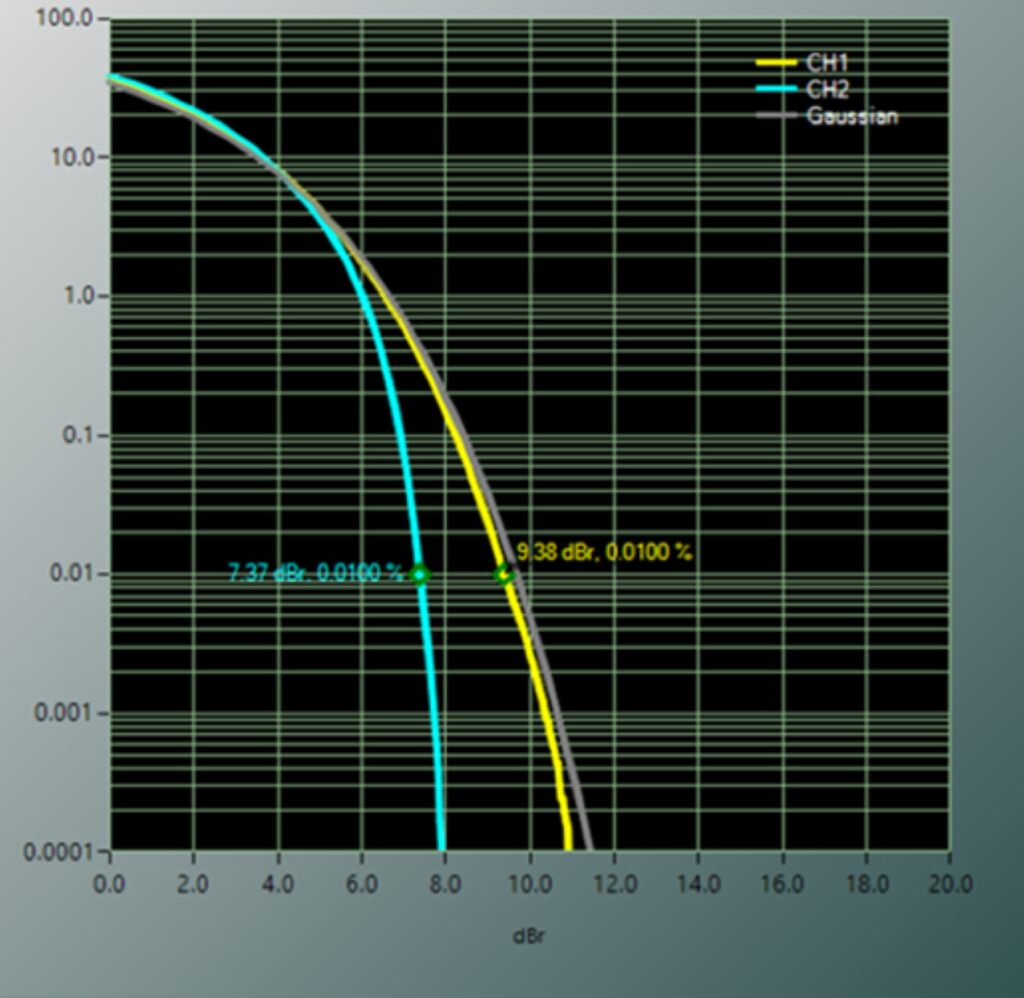
You can assess amplifier non-linearity and compression using average-detecting power sensors or network analyzers to get a plot of POUT vs PIN. This does not, however, reveal the impact on the PAPR of a complex m-QAM OFDM signal. Fortunately, there is a simple solution that you can apply. This is to use high sample rate peak power sensors with video bandwidth that is wider than the signal channel being measured. Those power samples are used to determine the signal PAPR and plot complementary distribution function (CCDF) curves. A CCDF curve is a plot of the probability of a modulated signal exceeding a specific PAPR. The setup is simple and uses power sensors P1 and P2 shown in Figure 6; the sensors must measure peak and not just average power. Using those sensors, together with the appropriate analysis software, provides the CCDF at the input and output of the amplifier thus revealing the PAPR reduction.
Figure 6 shows this result using Boonton RTP5000 peak power sensors and Boonton Power Analyzer software. The y-axis shows the probability of exceeding the PAPR level indicated on the x-axis. Figure 6 shows that 99.99% of the time, the input signal has a PAPR of ~9.4 dB while the amplifier compression reduced the output signal PAPR to ~7.4 dB, which could lead to bit errors.

Antenna pattern measurement
Lastly, let’s look at antenna pattern measurement. Whether the antenna is a mechanically steered dish or an electronically steered phased-array panel with multi-beam spatial multiple access capability and the ability to point nulls towards interferers, you must characterize the antenna pattern. This is usually represented by polar plots in azimuth and inclination planes. Power sensors provide a simple and convenient way to make these measurements.
The antenna is mounted on a turntable. One power sensor is coupled to its feed monitoring the transmit power level to ensure it remains constant during the antenna rotation. A second power sensor, coupled to a standard-gain horn, is in the antenna’s far field. The measurements taken from this power sensor are used to produce the antenna pattern plots. To have an optimum combination of angular resolution and speed of measurement, it is desirable to choose a power sensor that provides a fast measurement rate.
We’ve touched on several key physical-layer measurements that help to provide confidence that the individual system blocks and the overall system, when deployed, will perform reliably. The measurement techniques presented here do not only apply to gateways. You can apply similar techniques to terminals and satellites.
Bob Buxton is product manager at Wireless Telecom Group, a test and measurement company consisting of the Boonton, Noisecom, and Holzworth brands. Bob has previously held positions in R&D and product management for MACOM, Marconi, Advantest, Tektronix, and Anritsu. His R&D experiences have involved microwave subsystems and synthesizer design. Bob holds a master’s degree in Microwaves and Modern Optics from University College, London and an MBA from George Fox University, Newberg Oregon. He is a Chartered Engineer and Member of the Institution of Engineering and Technology.