‘SimplyTrace’ is an extension included in its ‘UDE’ (universal debug engine) tool’s 2023 release, and initially works with Infineon’s Aurix family, Arm Cortex MCUs with CoreSight debug and trace, and PowerArchitecture devices with Nexus Class 3 trace support.
“For efficient use of trace, the trace system of the microcontroller used must first be configured,” according to PLS. “This is usually not a trivial matter. The whole process can be time-consuming and often requires in-depth knowledge of the SoC’s trace system.”
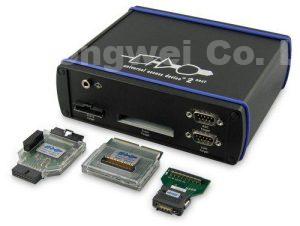

PLS’ UAD2next debug hardware
The trace extension takes trace functions from typical use-cases and attaches them to the debugger’s views in a context-sensitive manner that is intended to be, as far as the user is concerned, without knowledge of the underlying mechanisms needed.
For example, said PLS, trace recording can be configured directly from the source code window for ‘trace from source code line’ or ‘trace to source code line’ use-cases.
Experienced users, said the company, can customise the resulting trace configuration, or use it a template, using the regular UDE configuration tools such as its UEC (universal emulation configurator).
“The implementation is based on an increasing abstraction across different layers,” said PLS. “The bottom layer contains the functions of the on-chip trace components, while the top layer reflects the software developer’s use-cases. This approach makes it easy to extend the system with respect to new trace architectures as well as further use cases.”
So far, commonly-used program trace functions as well as basic data trace – such as observation of data accesses to variables, have been provided. Data trace of register accesses, and task trace for real-time operating systems, are amongst those in development.
View more : IGBT modules | LCD displays | Electronic Components